Every ten years, the United States census is conducted. The census is incredibly important for a wide range of reasons, but the data it provides for research and analysis is vital to understanding how any given city is changing. The more a city changes, the harder it can be to analyze, as the bounds of census tracts also shift with every census. This makes longitudinal comparisons difficult when comparing census data across multiple decades.
In Housing unit and urbanization estimates for the continental U.S. in consistent tract boundaries, 1940–2019, authors Scott N. Markley, Steven R. Holloway, Taylor J. Hafley, & Mathew E. Hauer use novel interpolation and blending techniques to combine historical housing data to create what is probably the best long-term dataset of US housing unit trends. The data provides decennial housing unit totals between 1940 and 2019. Using similar techniques in ArcGIS Pro, we can extend this until the current day (although 2026 is an estimate based on census trends). This provides us with housing data on Louisville for every decade between 1940 and 2026, allowing for analysis of long-term housing trends in the city.
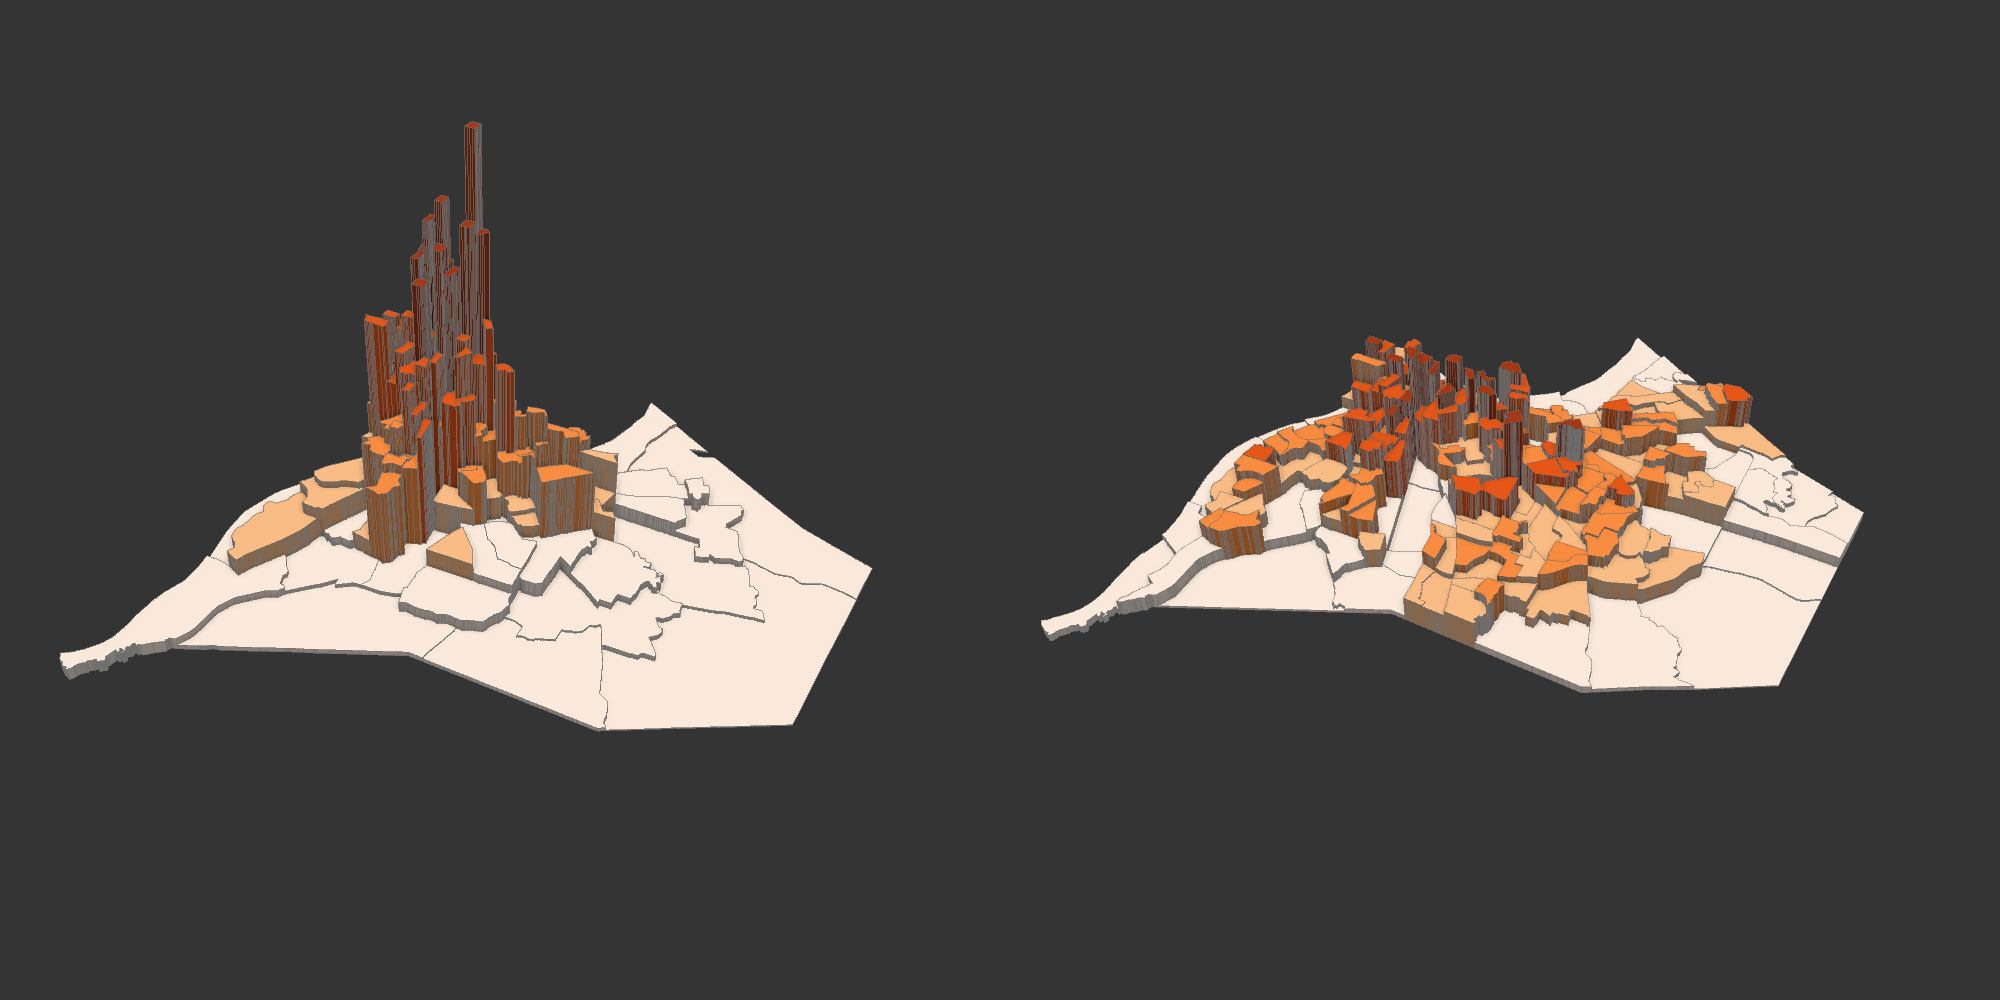
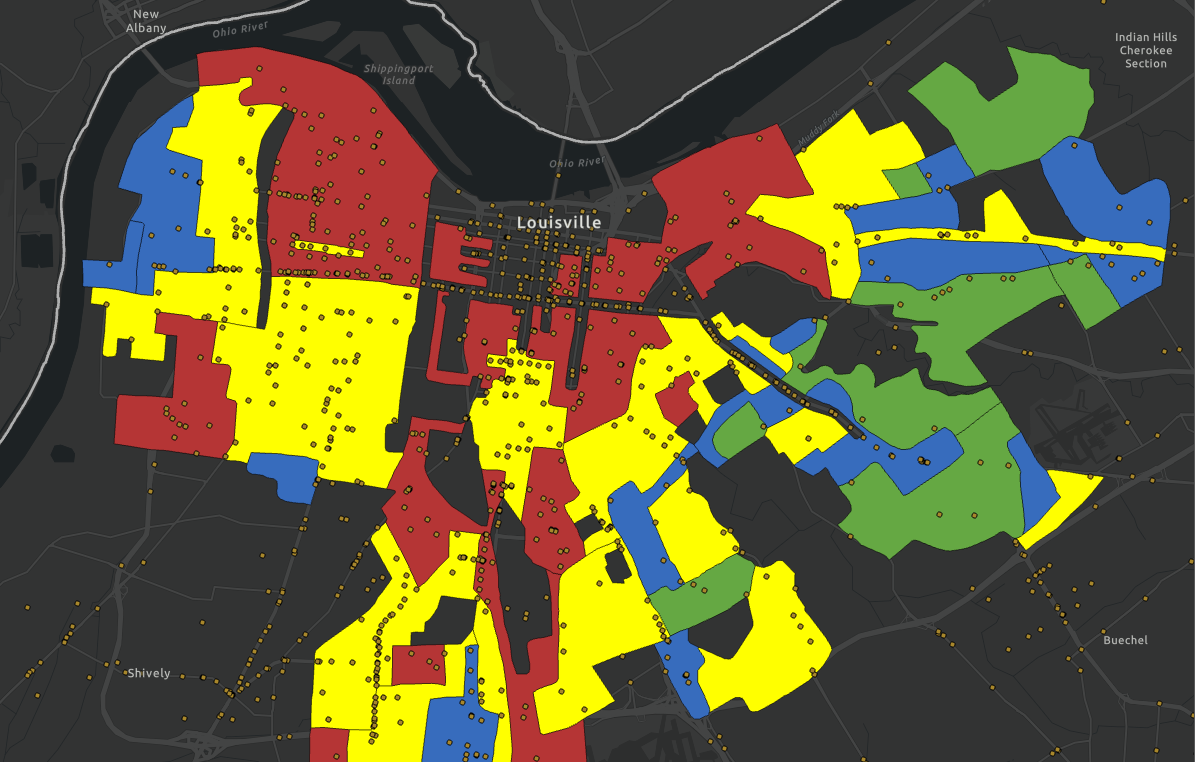
Suburbanization has been a dominant spatial trend of nearly every American city since the 1960s, and Louisville is no exception. Urban renewal and white flight have led to a mass exodus of population from Louisville’s urban core to the suburbs. This can be seen in the relative change of housing units between 1940 and 2026.
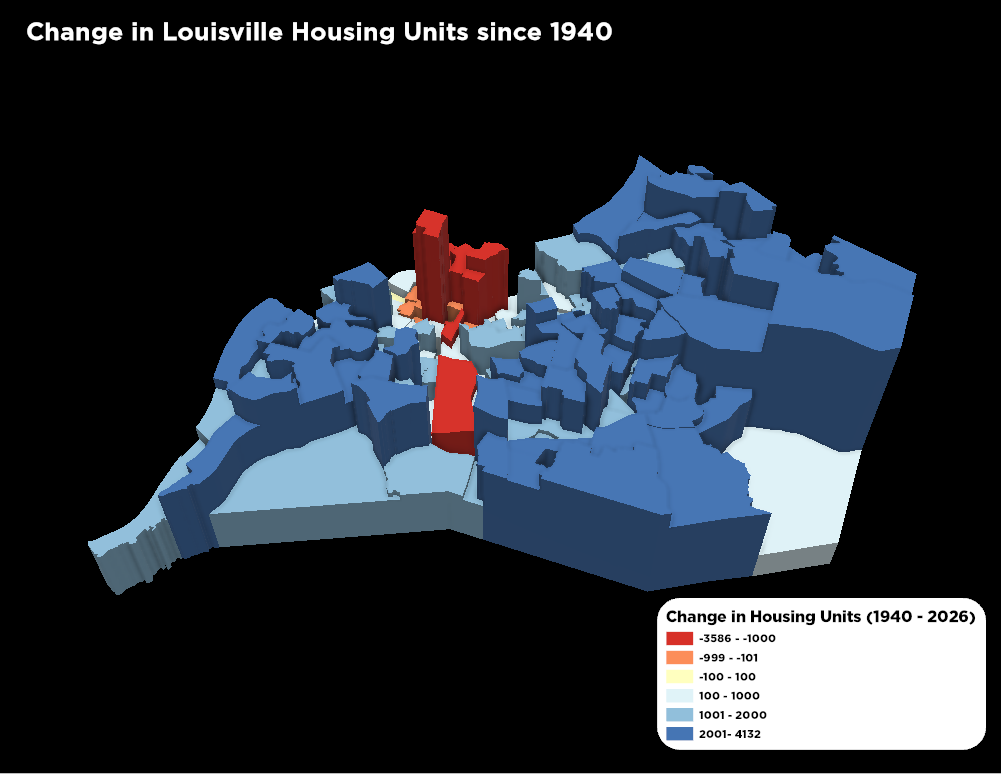
The difference between the old city of Louisville (pre-merger borders) and Jefferson County could not be more stark. Since 1940, only 12% of housing unit growth occurred in the old city boundaries. 25,622 units have been added in the old city, generally along the fringes in neighborhoods such as Kenwood Hill, Woodlawn Park, and the Highlands. Neighborhoods closer to the Central Business District almost all lost a significant amount of housing units. The closest area to the CBD to see some growth was the tract on the southern edge of Old Louisville, although even that tract has been losing units over more recent decades. Many neighborhoods on the western edge of the old city have remained stable since 1940, but have seen little growth.
In the rest of the county, 209,151 housing units have been added since 1940. Many of these areas see massive growth percentage-wise, as they were often barely inhabited during the 1940 census. Neighborhoods such as McNeely Lake, Fincastle, and Douglass Hills saw massive growth as they grew from farmland with 10-30 residents to almost completely developed suburbs.
There is a ton of relevant data that can be parsed through the app below, which allows you to navigate through the data in Louisville and see the change in each tract. Clicking on a tract shows more information, including the housing unit totals and percent change for 1940-2010, 2019, and 2026.
Click here to view on mobile or open in a separate window
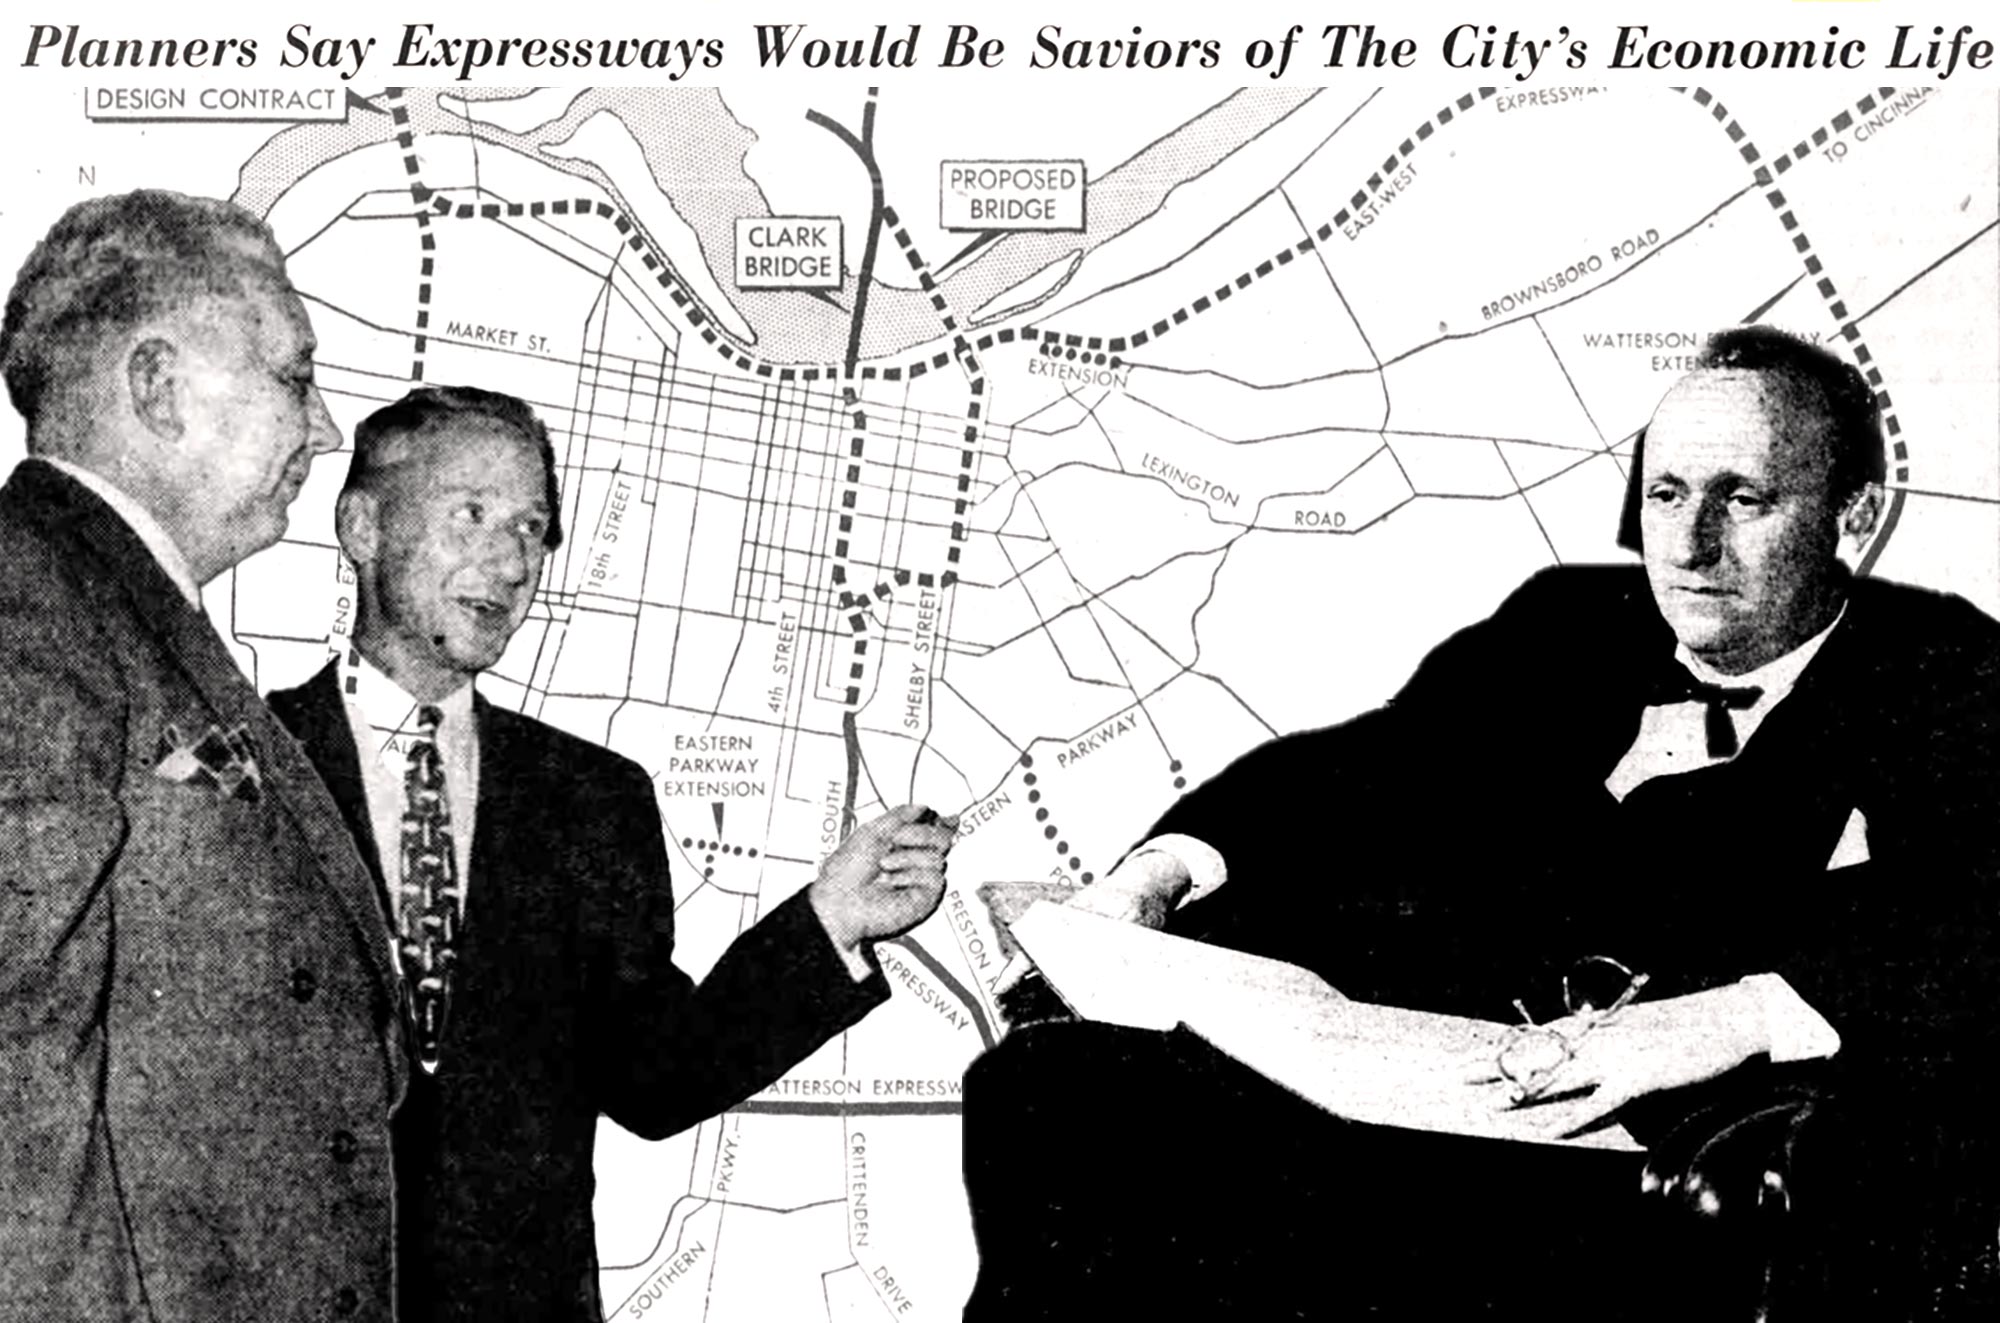
The impact of urban renewal is made clear by the neighborhoods where the biggest loss in housing units is seen. Smoketown embodies much of the urban renewal policy of the 1950s onward and has never recovered from it. The area was home to one of the city’s first public housing projects, made way for by “slum clearance” programs. Smoketown was also split in two by I-65, which further destroyed many homes and displaced large swathes of the population. The impact of expressways is notable across the board; the tract covering the eastern edge of Old Louisville, where I-65 is located, lost more housing units than the other tracts that make up the historic neighborhood. Generally, historically redlined and “renewed” communities see the biggest housing loss.
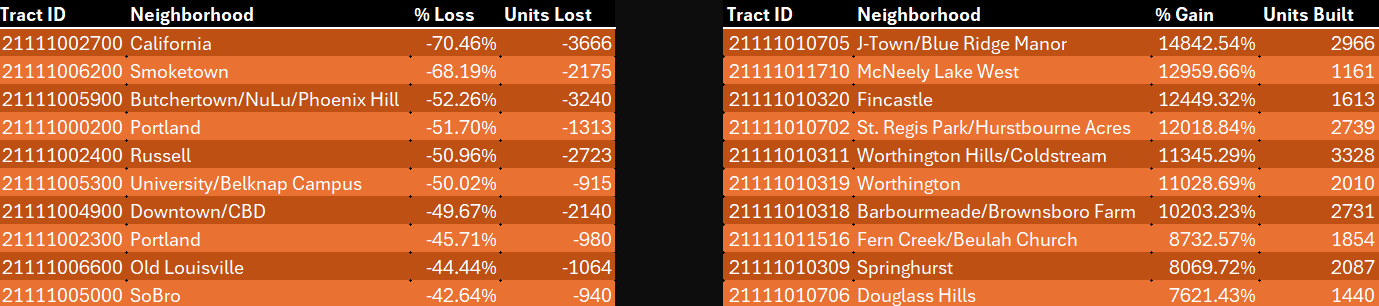
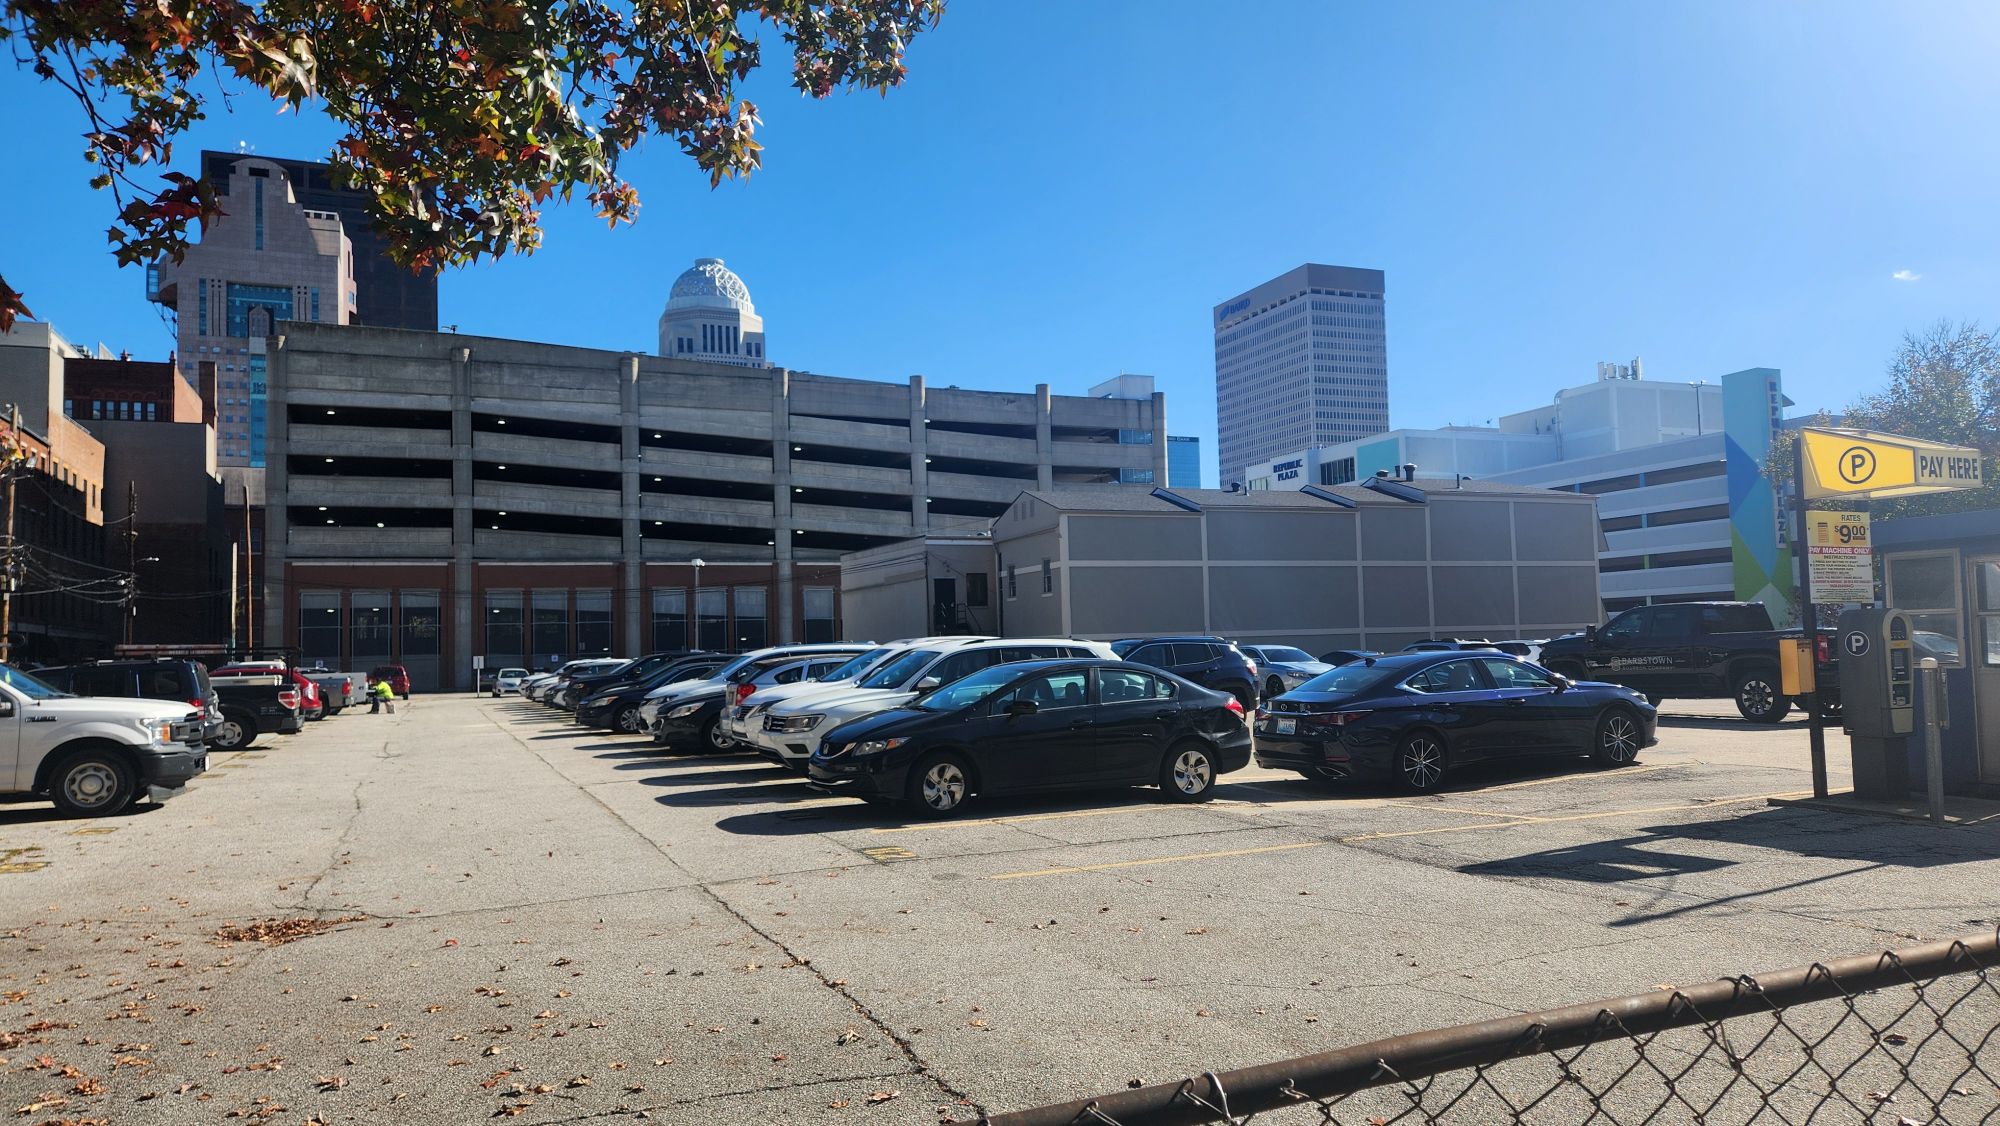
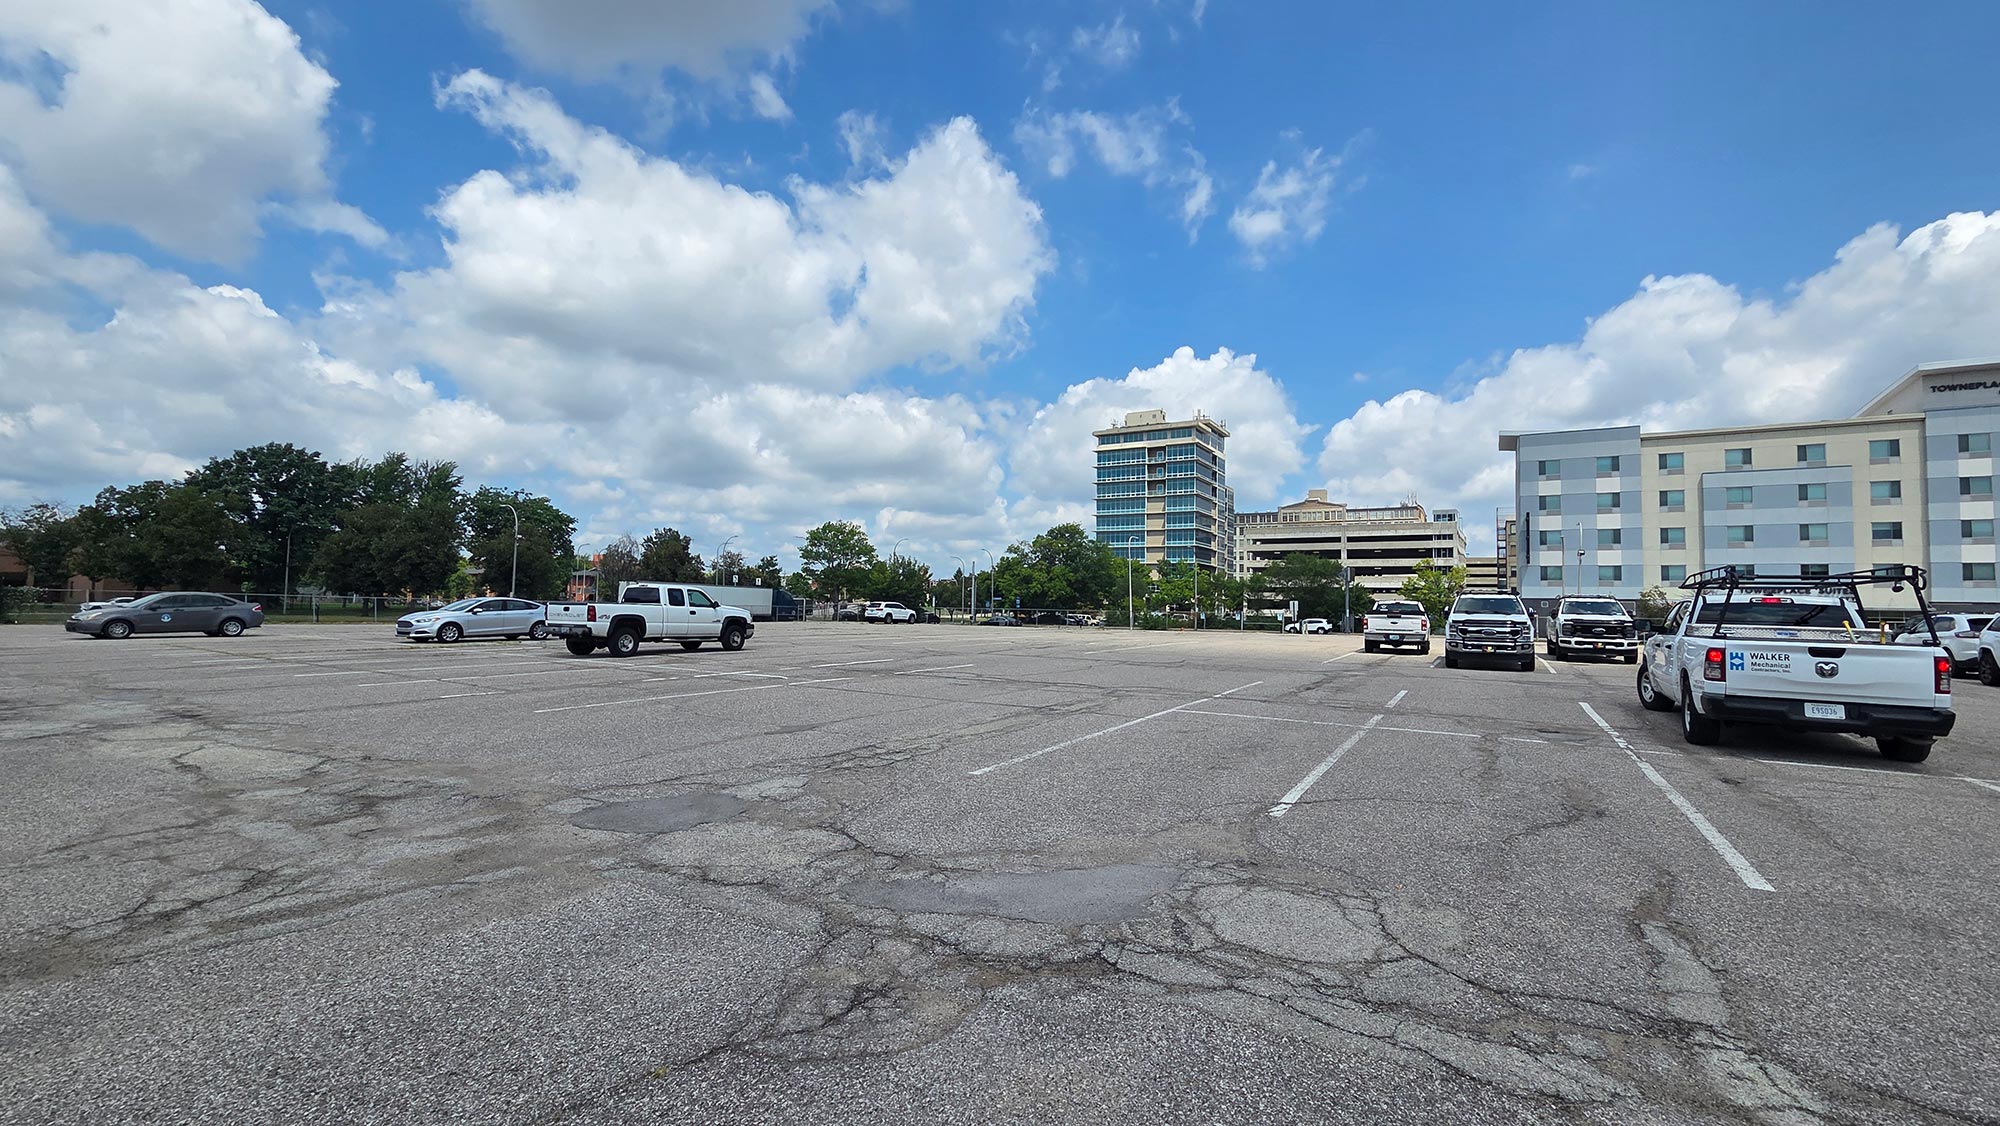
On the other hand, the massive growth in suburban housing is obvious. The trend towards suburbanization brings with it many externalities for the city. If suburban residents commute downtown for work, more parking facilities are required, which takes even more space away from downtown residents and businesses. A lack of housing will also incur affordability problems [2] for urban residents, potentially furthering displacement. Suburbanization is a primary driver of car dependency, which has a wide range of negative impacts on human health, ranging from obesity to social isolation. While the app and numbers shown in this article are not comprehensive, they show that housing supply has drastically reduced in many Louisville neighborhoods and that suburbanization has come to define our city’s landscape.
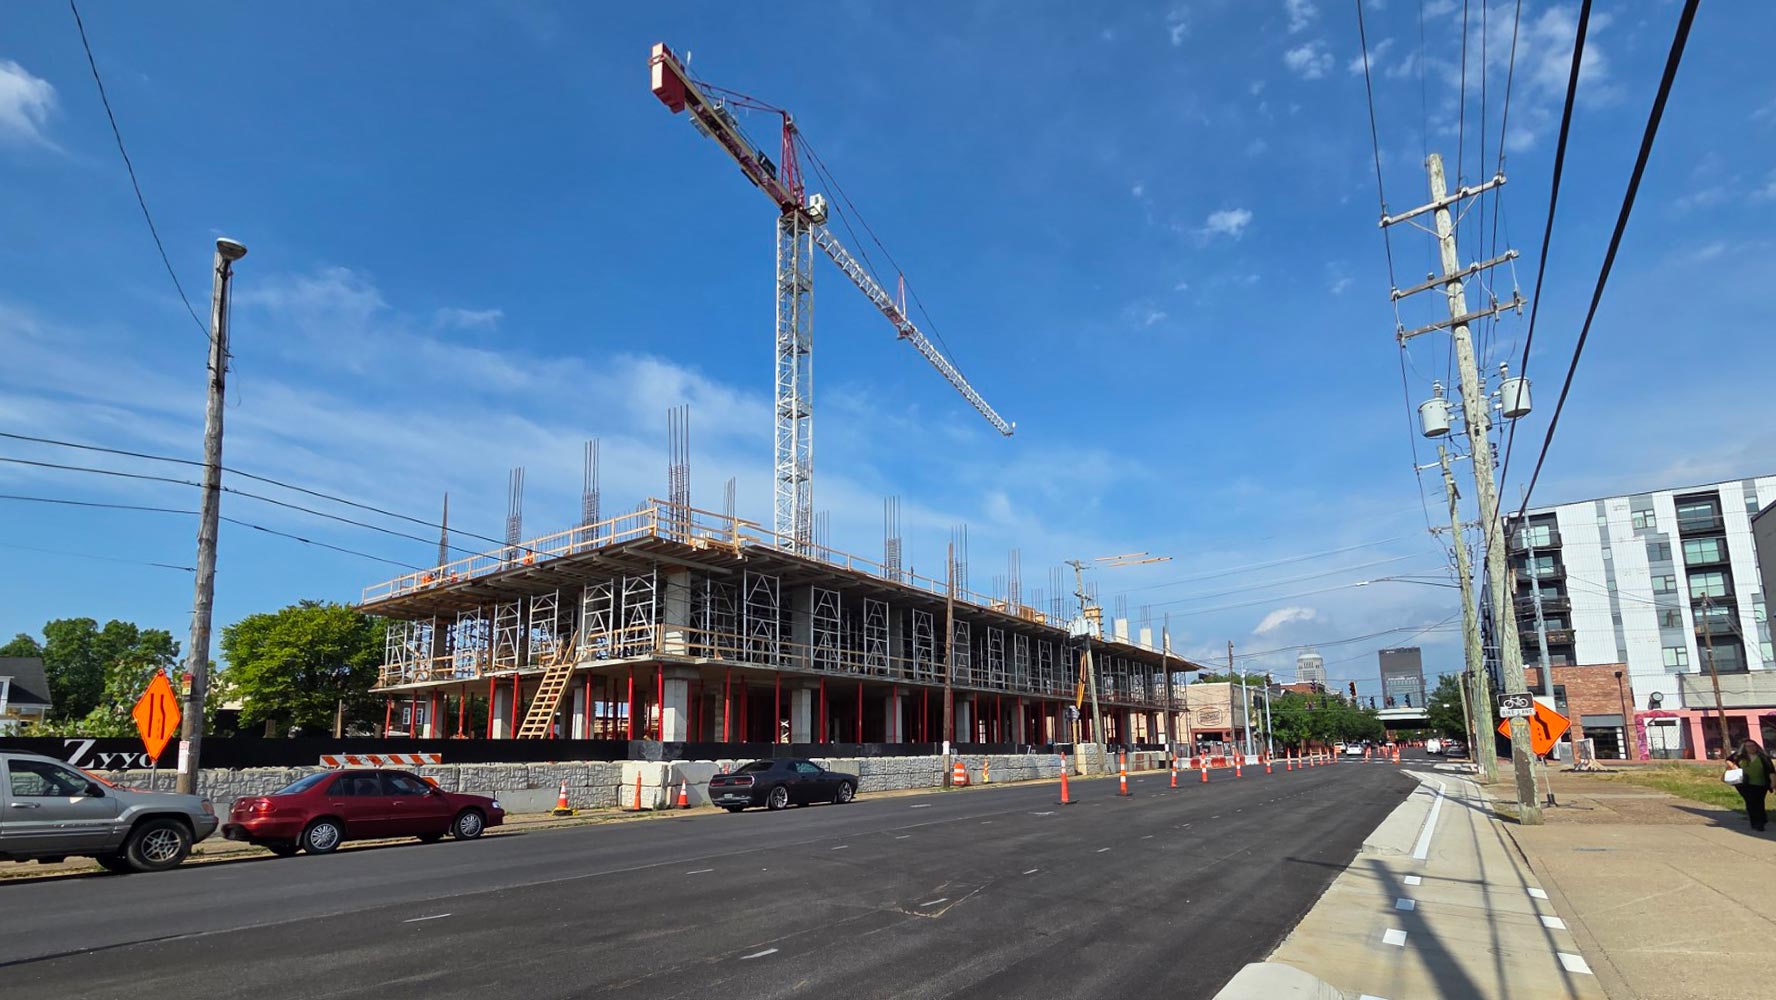
It is not all doom and gloom, however. Many of the urban neighborhoods that have seen decades of decline in housing stock have stabilized or started trending upward in recent years. Younger folks are increasingly preferring [2] to live in cities when it is affordable to do so, and have a preference for walkability. Downtown and surrounding neighborhoods also have a decent number of housing projects down the pipeline, such as Liminal, NuLu Crossing, Rhodia, and Motorworks. These projects will help put a band-aid on the wound, but more housing stock will be required to fill the gap that remains.


.png)