Cities often have an uneven distribution of environmental and public health risks. The Christina Lee Brown Envirome Institute seeks to model disparities in risk across Louisville utilizing an environmental vulnerability index. This is a vital place-based tool that can be utilized to assess threats to public health and identify potential solutions.
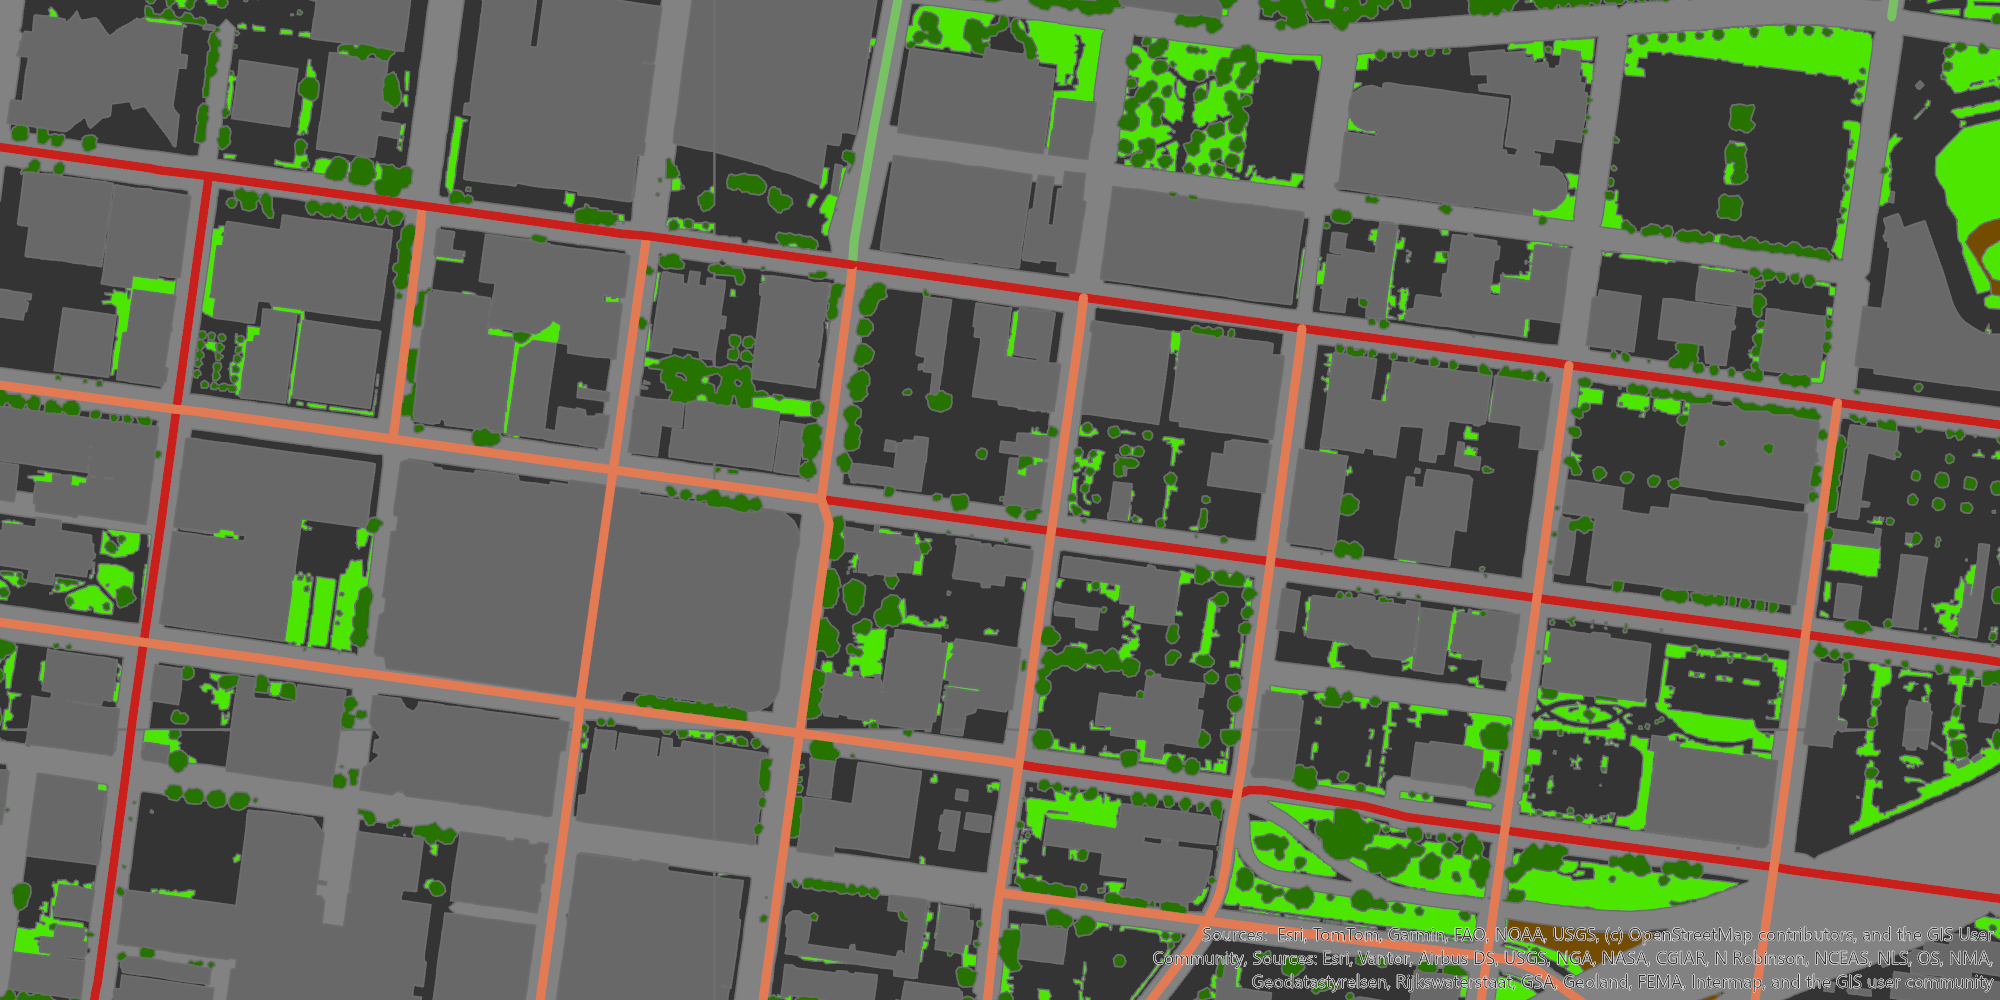
The index uses 32 different indicators to create a composite score for census tracts in Jefferson County. Some indicators are outside the realm of urban design (i.e. tornado frequency, insurance coverage), but many indicators are partially or heavily influenced by the design of our city. Tree canopy coverage, traffic exposure, access to housing, and access to transit are among some of the vital factors.

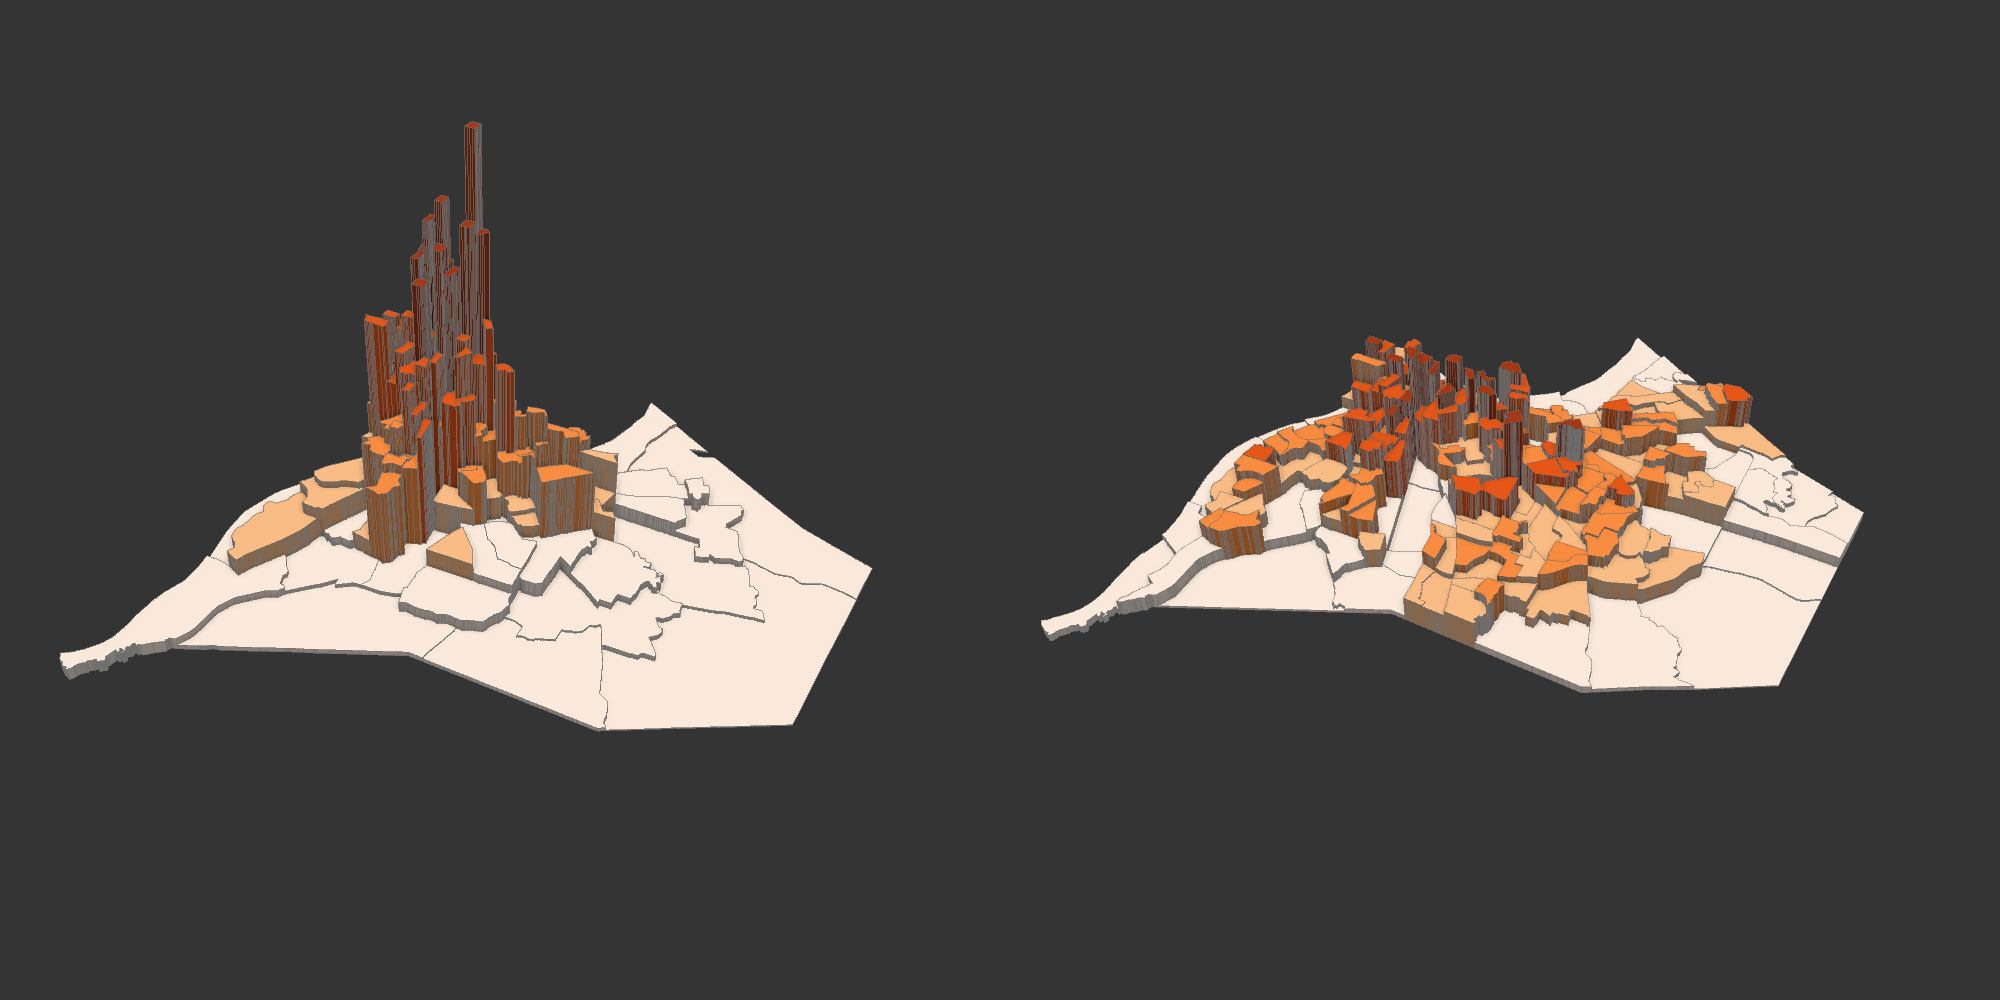
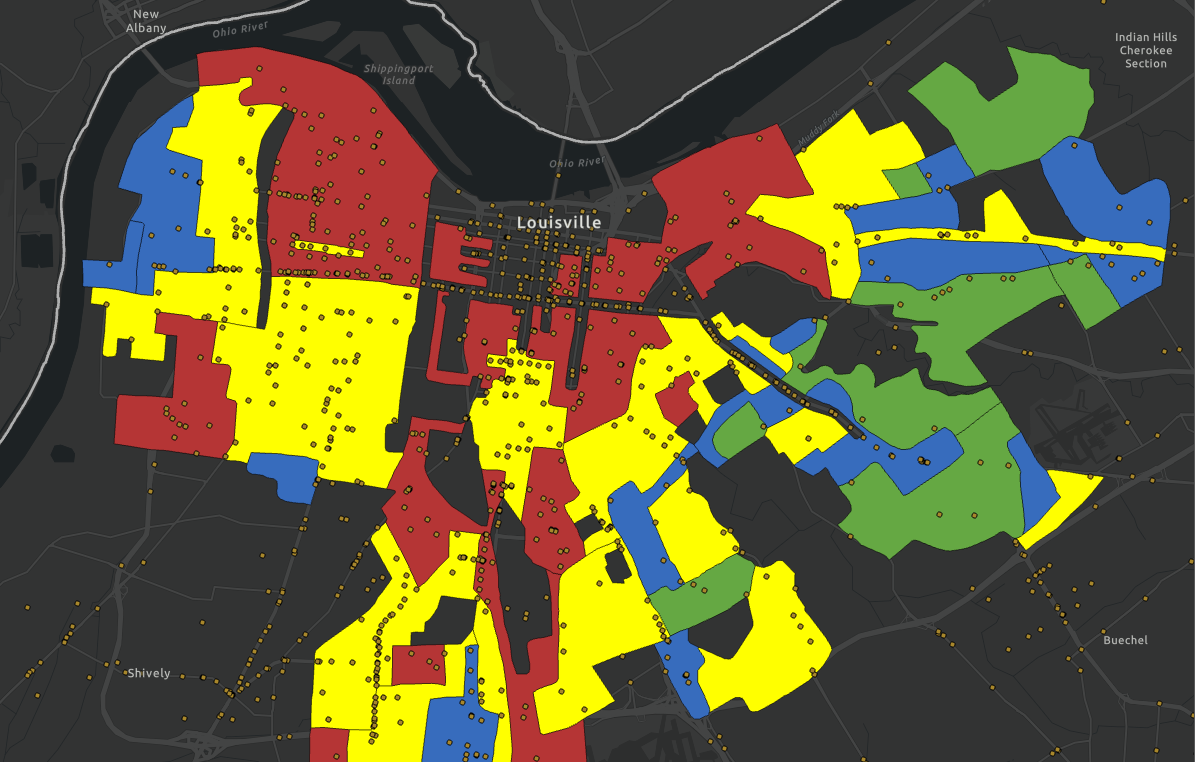
Difference in design and access to certain amenities can be clearly seen in what areas of Jefferson County are more at risk. Much of Western Louisville is a food desert, and has many car-free households that may struggle to get around the city on public transportation. Many of the at-risk tracts in central Louisville are exposed to high amounts of noise and air pollution from the airport. These tracts rank high due to a wide range of indicators, but the ones mentioned so far are some of the most easily explainable ones.
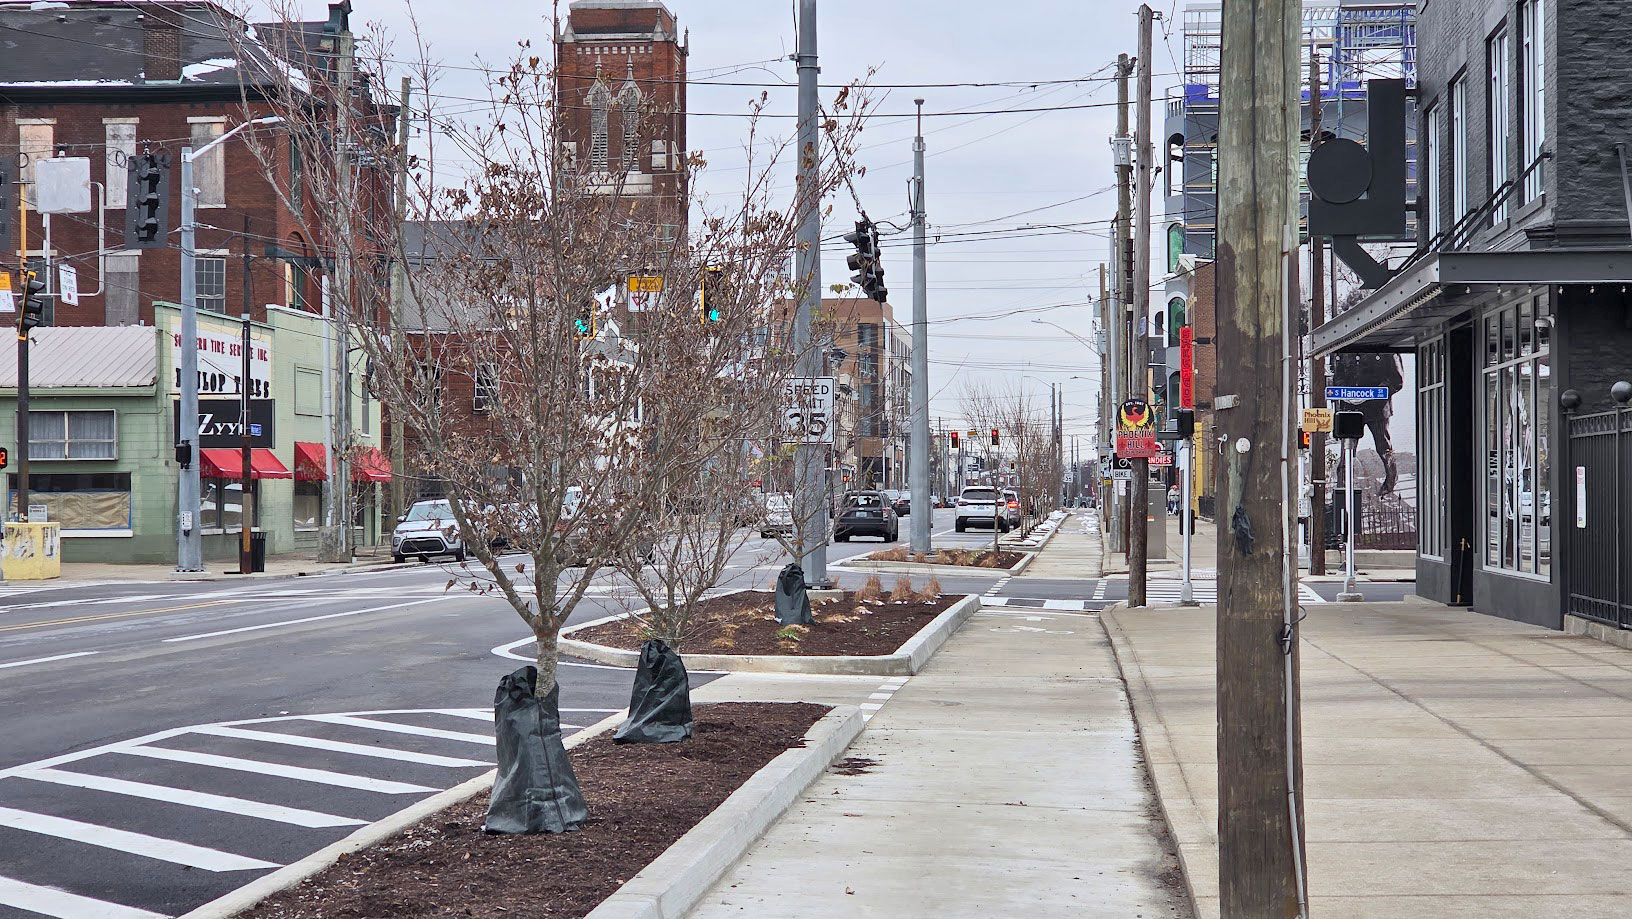
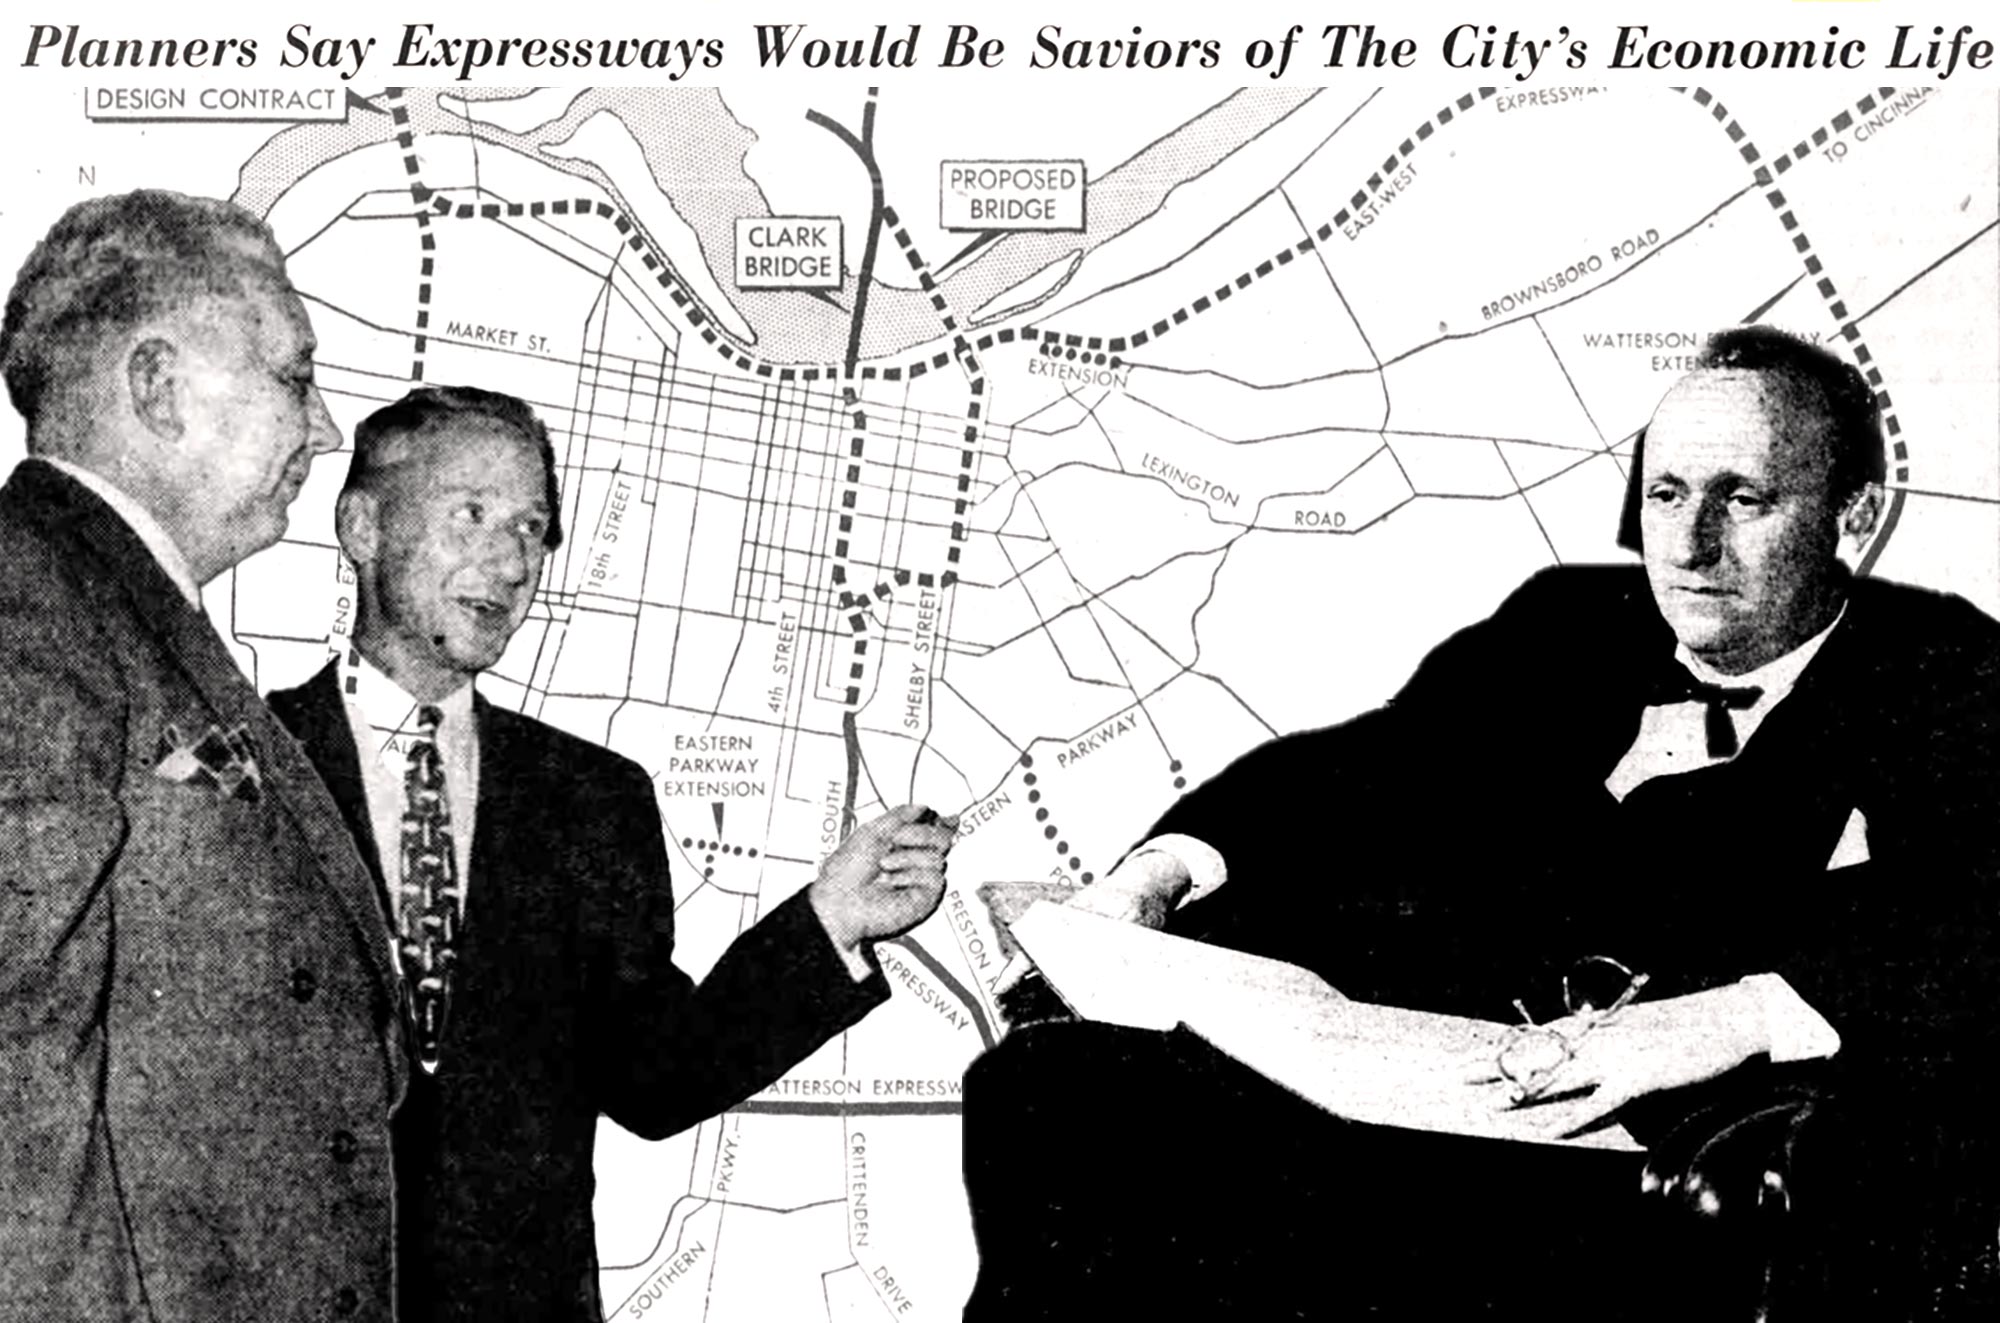
The most at-risk tract is 21111005900 in the urban core; this area contains NuLu, Phoenix Hill, Butchertown, and, ironically, LOUMED (the city hospital district). This tract faces many of the issues mentioned so far. It is the home of spaghetti junction, and is bordered on two sides by expressways that emit a good amount of sound and air pollution. The area also has a lengthy history as part of the city’s industrial core which can influence health across generations, and some industry still exists and is notable for its strong smell. Tracts that are deemed to be less at risk tend to be richer, have easier access to transportation, better access to greenspace, and be a larger distance from heavy industry.
Of the tracts analyzed, five were selected for “intervention”. These tracts are the most vulnerable tracts in the county, all five of which are designated as disadvantaged by the Climate and Economic Justice Screening Tool (CEJST). These tracts were tested for a variety of interventions such as canopy growth, noise pollution reduction, wetland restoration, and increased pollution compliance monitoring.
The Urban Design Studio has recreated the static index map in a web application that can be seen below or accessed through this link. A web page with additional information about the index can be accessed here.