Vision Zero has been a prominent goal for Louisville transportation planners for around the past decade. The city has created a great dashboard that tracks crashes and a ton of factors related to them such as weather, injuries, demographic information, and so on. While the dashboard is great for most purposes, there is only so much analysis you can do through an easily accessible online dashboard.
All crash data utilized by Vision Zero Louisville is publicly available, we have used it on multiple field notes in the past. This data can be utilized to really nail down what roads in Louisville are collision-prone and have the highest fatality rates. My last field notes post covered the most dangerous intersections, but this will cover all pieces of road across the county so we can have a comprehensive view of areas where all road users are more in danger.
The methodology for road segments will be different than that of the intersection analysis, but it will still show us segments of road with high amounts of danger that are likely in need of roadway modifications. The largest difference is that this does not factor in traffic counts. This data was luckily available for most intersections with a significant amount of crashes but this is not the case for many road segments. We are also now including expressways in the road data, which were excluded before because there are not any intersections. Lastly, rather than providing a “ranking”, we are using Getis-Ord Gi* hot-spot analysis to indicate hot spots sourced from a calculated crash rate. There is still a most dangerous segment of road that will be discussed later, but it is not calculated with the hot-spot analysis.
The data being used is the same as last time. This is crash data from 2014 - 2024 from the Kentucky State Police. Of the approximately 45,000 pieces of data, around 400 had to be deleted due to improper coordinate data.
Collisions
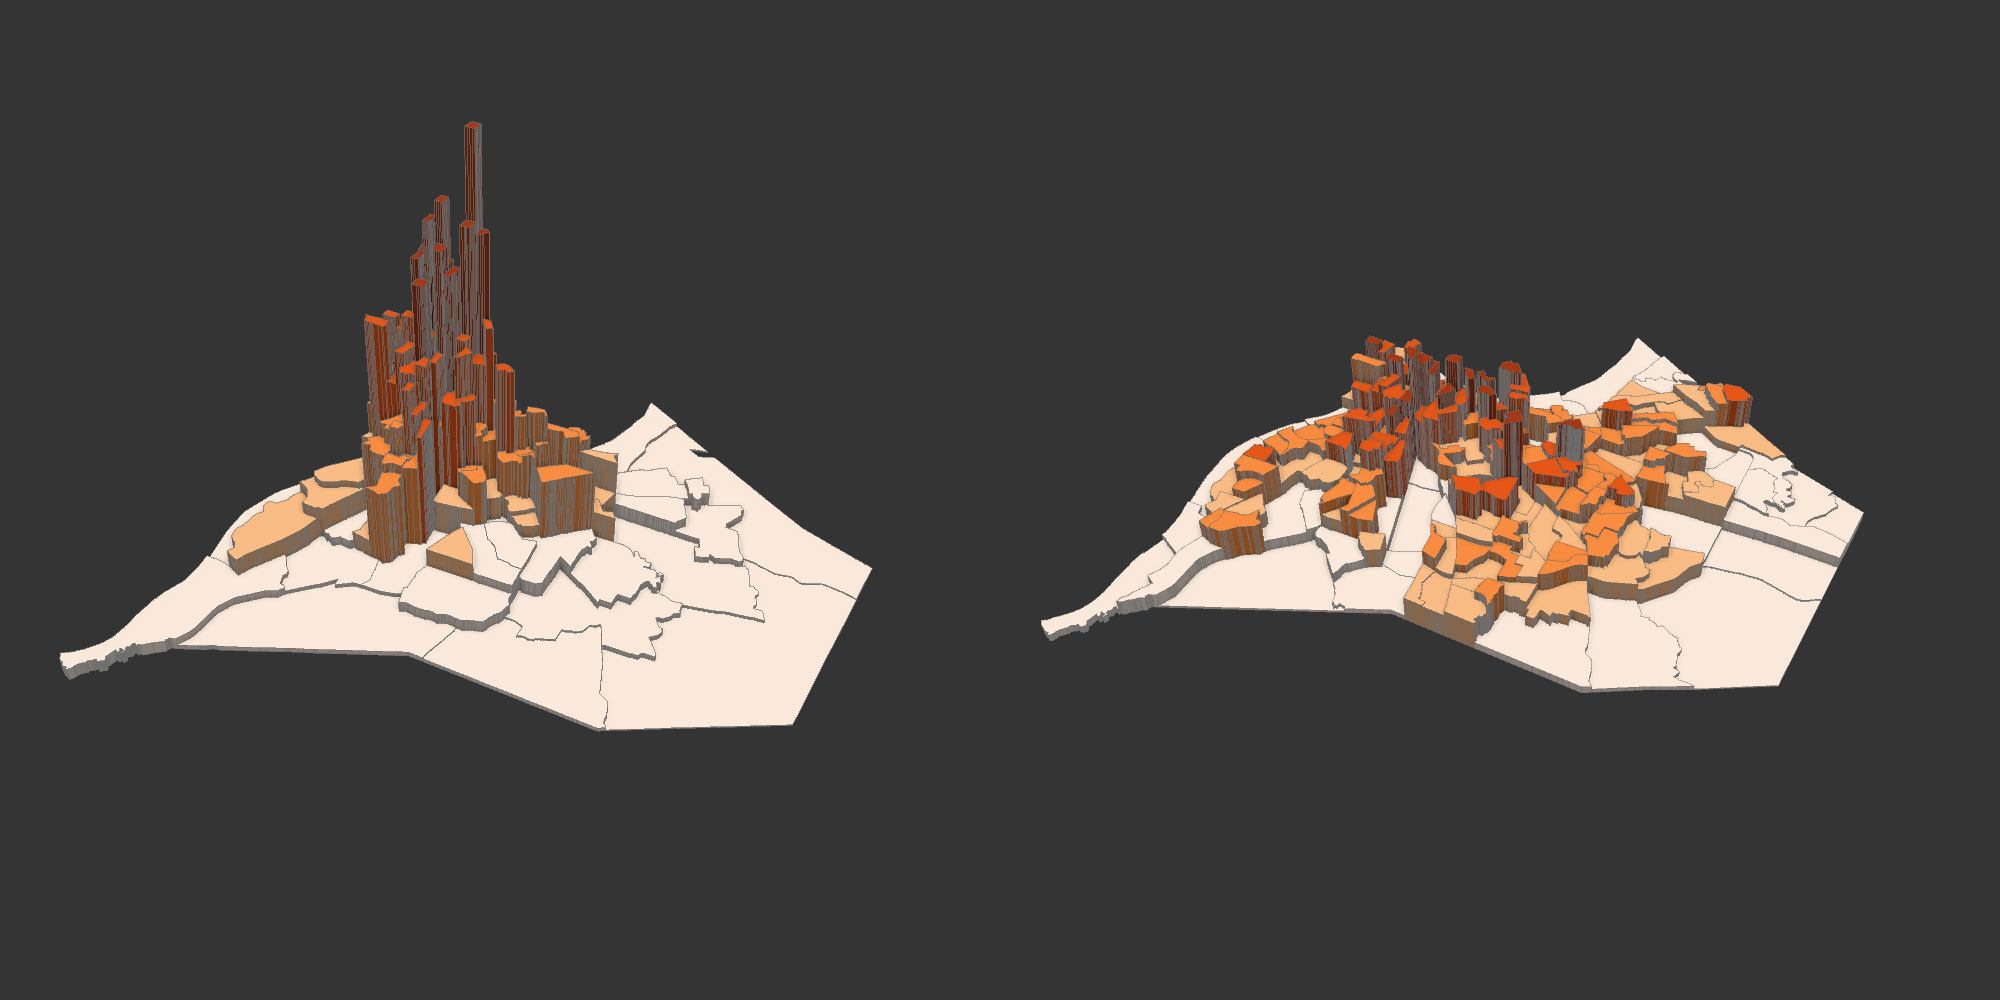
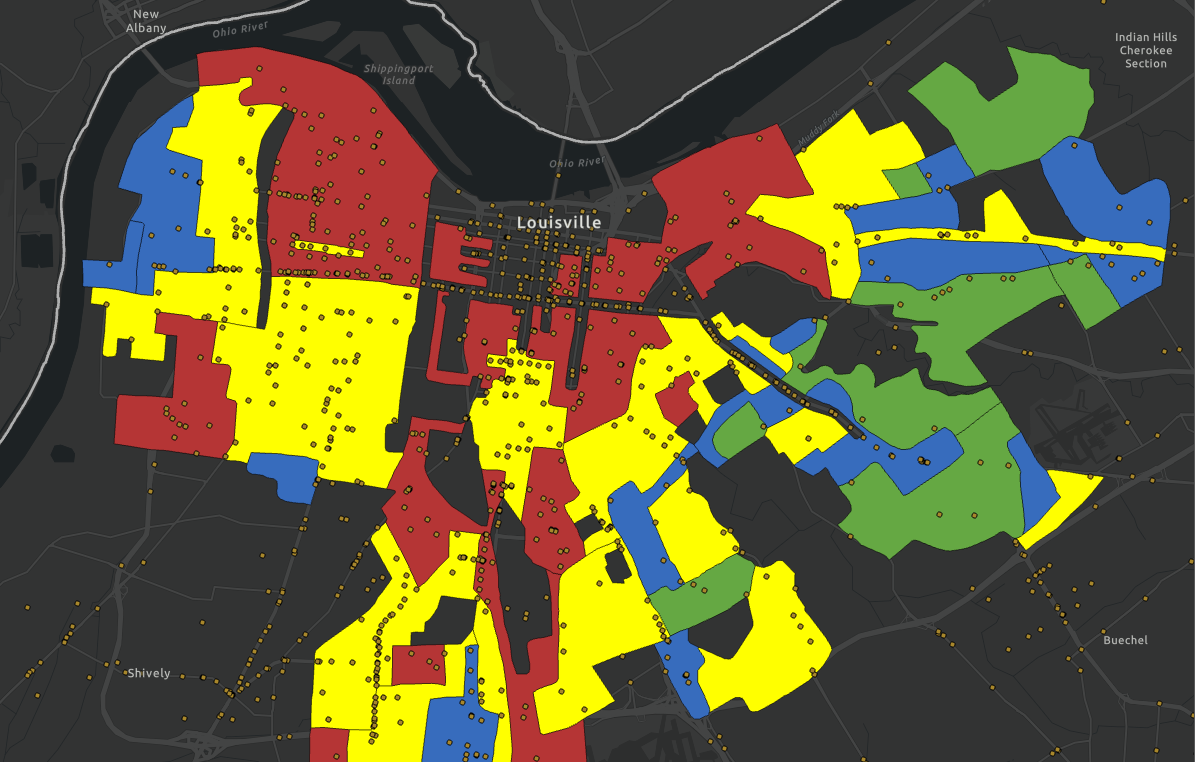
Collisions are much more numerous than fatalities and much more spread out. This makes it clear what roads as a whole are dangerous as you can see many segments will be designated as hot-spots relative to fatalities. Hot-spots are assigned 90%, 95%, and 99% confidence. A higher level of confidence indicates a higher crash rate and generally more dangerous segment of road. The web map below shows the hot-spots across Jefferson County.
Click here to view the map below in its own window.
There are a lot of hot-spots worth mentioning, but for the sake of brevity, let's just look at a few interesting trends. It is clear that the largest sources of these hot-spots are mostly a handful of roads: Dixie Highway, 3rd Street, Bardstown Road, and Preston Highway. These roads have high amounts of daily traffic which easily explains a lot of it, but very little expressway segments with way higher traffic counts are designated as hotspots. This likely indicates the danger that arises with high speeds, high traffic counts, and high amounts of intersections.
Another worrying aspect is the amount of hotspots within close proximity to schools. Of the 253 schools (public and private) in the dataset I have, 72 were within 1000 feet of a hot-spot. This is around 28% of all schools in Jefferson County. To be fair, some only have a single relatively small hot-spot nearby. The ones with the most hot-spots tend to be near to major arterial roads or expressways; while the expressways are “safe” in terms of incidents, the ramps and nearby roads are not.

While this methodology does not produce a traditional ranking, I know a lot of people always want to know the “most” of things like this. This isn’t as easy as you think, though. Even though this focuses on segments of road, the highest density of crashes relative to road size still occur in segments that cross large intersections. The most dangerous hot-spot fits that bill at the intersection of Taylor Blvd and Berry Blvd. The highest “ranked” one that doesn’t completely fit that would be Manslick Rd by the Iroquois Golf Course, but the segment is pretty isolated.

Fatalities
The intersection analysis post showed that collisions and injuries will generate extremely similar outputs, so this time only outputs for total collisions and total fatalities were generated.
Fatalities hot-spots are much more dispersed and often relegated nearly entirely to smaller road segments near intersections or larger ones that cross intersections.This does indicate intersection crashes may be more likely to cause deadly crashes. This means this map below is not significantly different from the intersections map from the previous field notes post, but it is still worth looking at.
Click here to view the map below in its own window.
Most of the hot-spots this time are 99% confidence. This is likely due in part to the smaller range of fatalities in a given road section. The difference between a 90% confidence hot-spot and 99% may only be 1 or 2 fatalities.
Schools were arbitrarily chosen as a point of analysis in the last section as I was poking around the map with the data. If you are just looking at the fatalities, the connection is not really there. Only a small amount of schools have nearby hot-spots. This is still something that should be assessed and fixed, but it can be reassuring in comparison to the previous section.

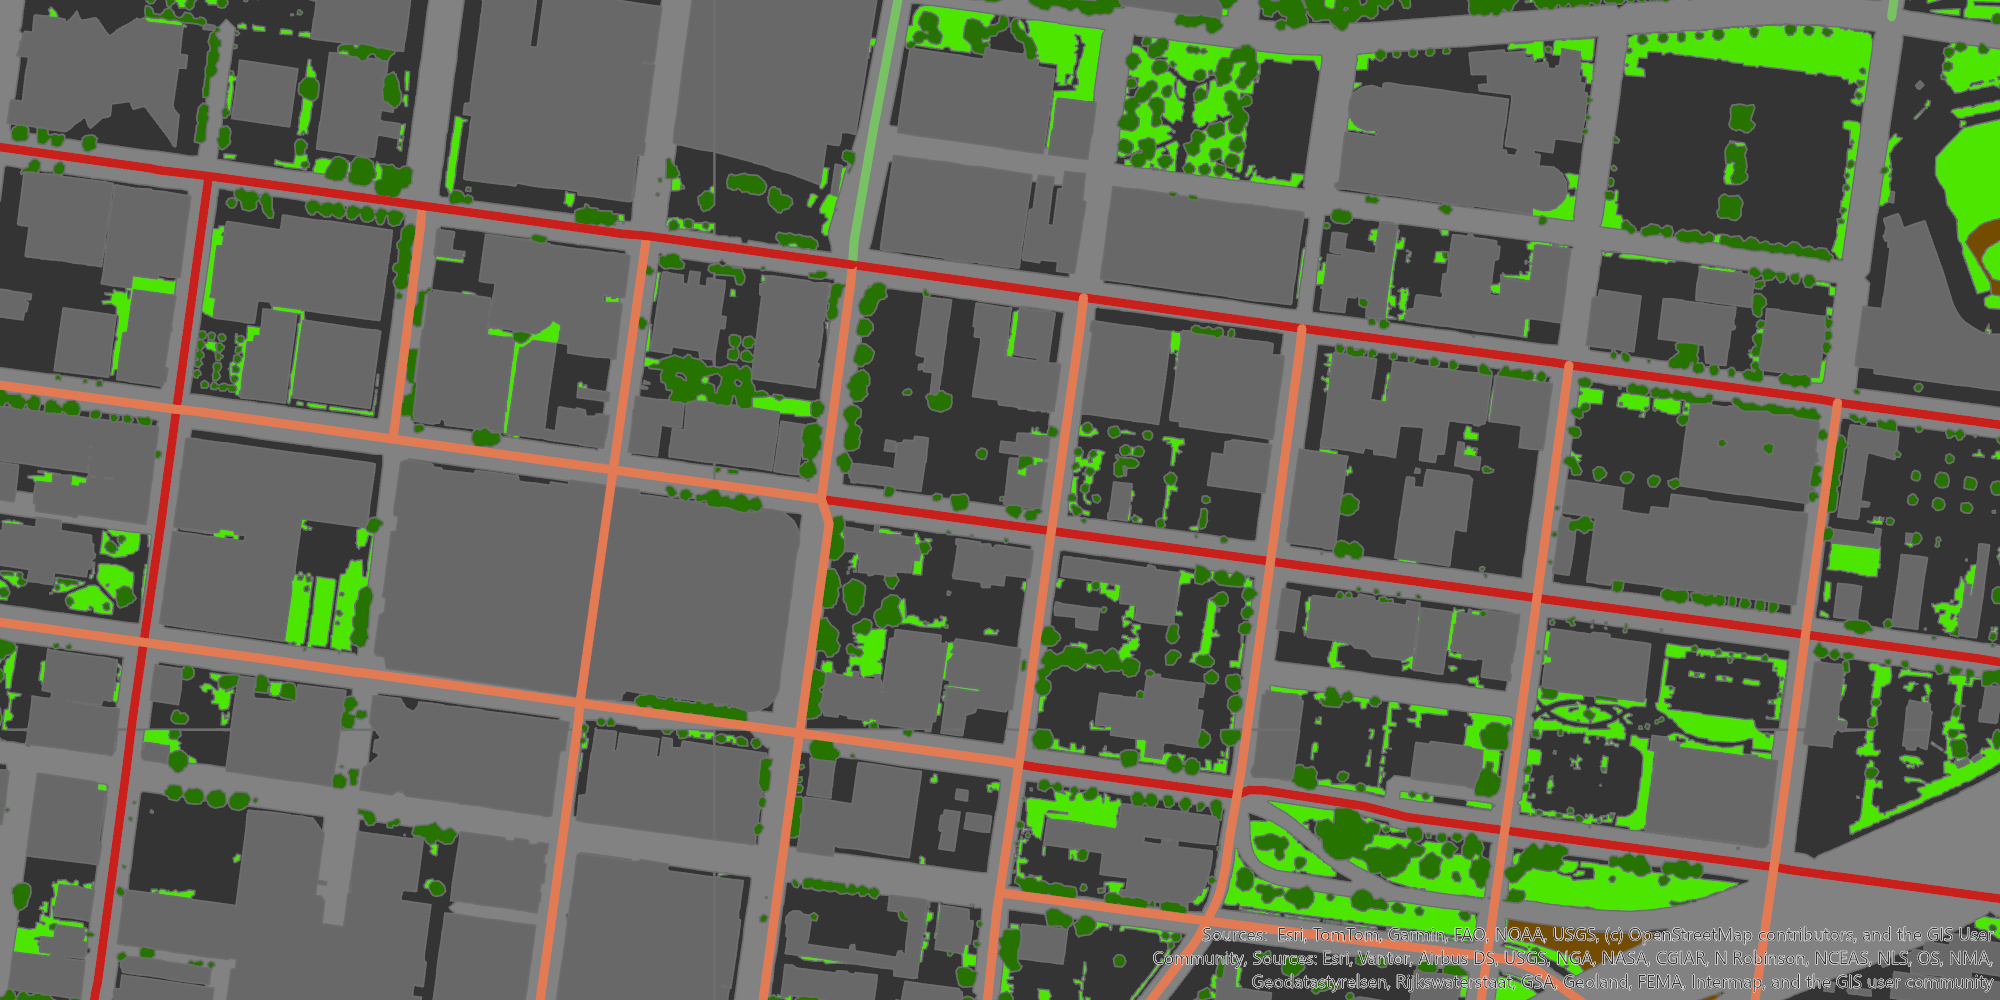
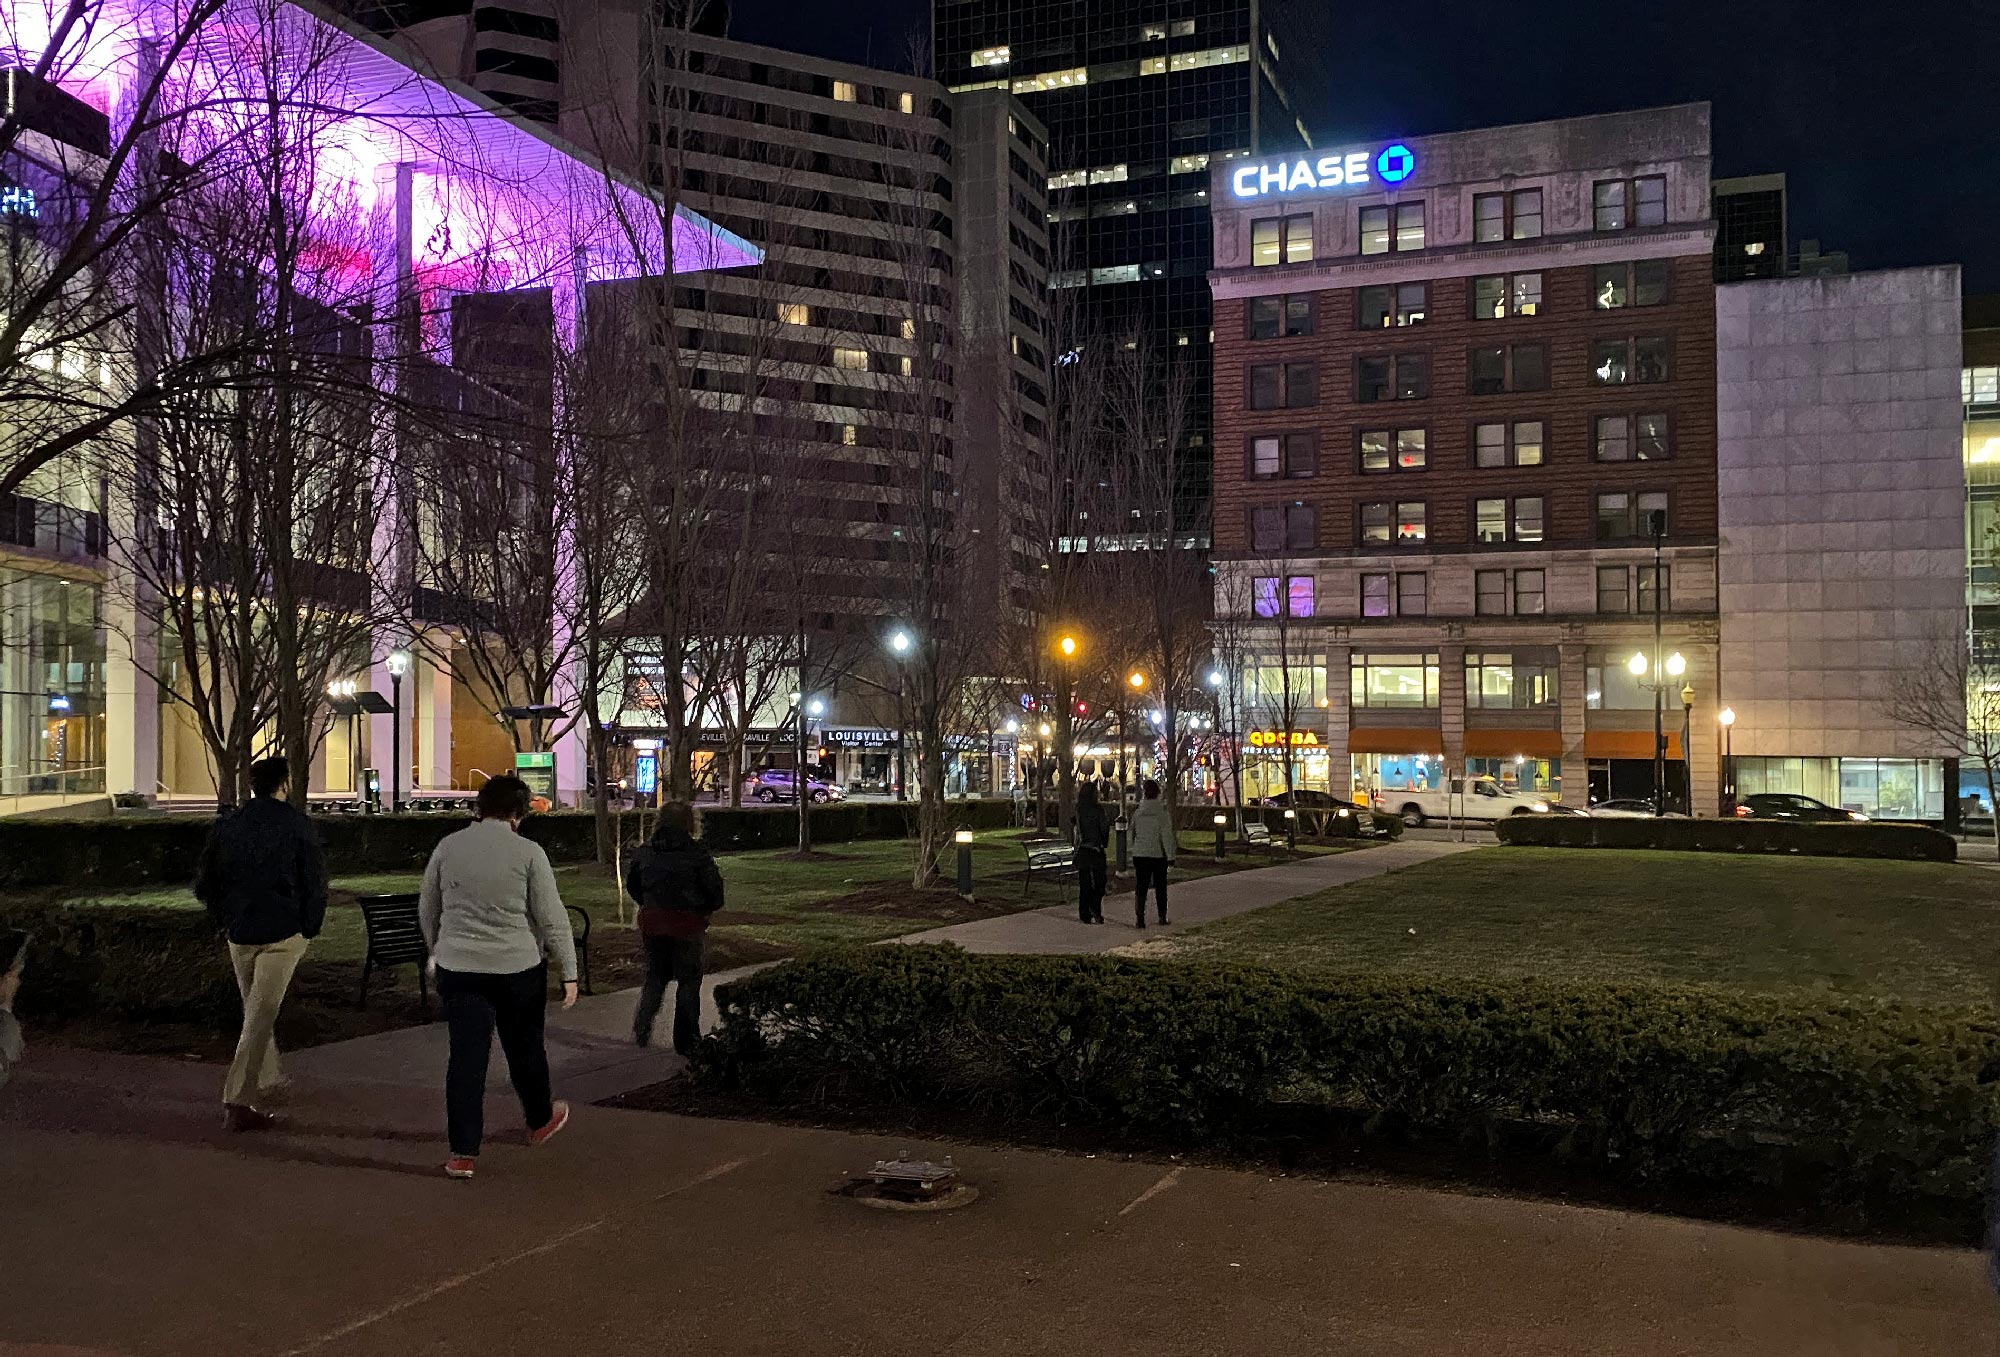
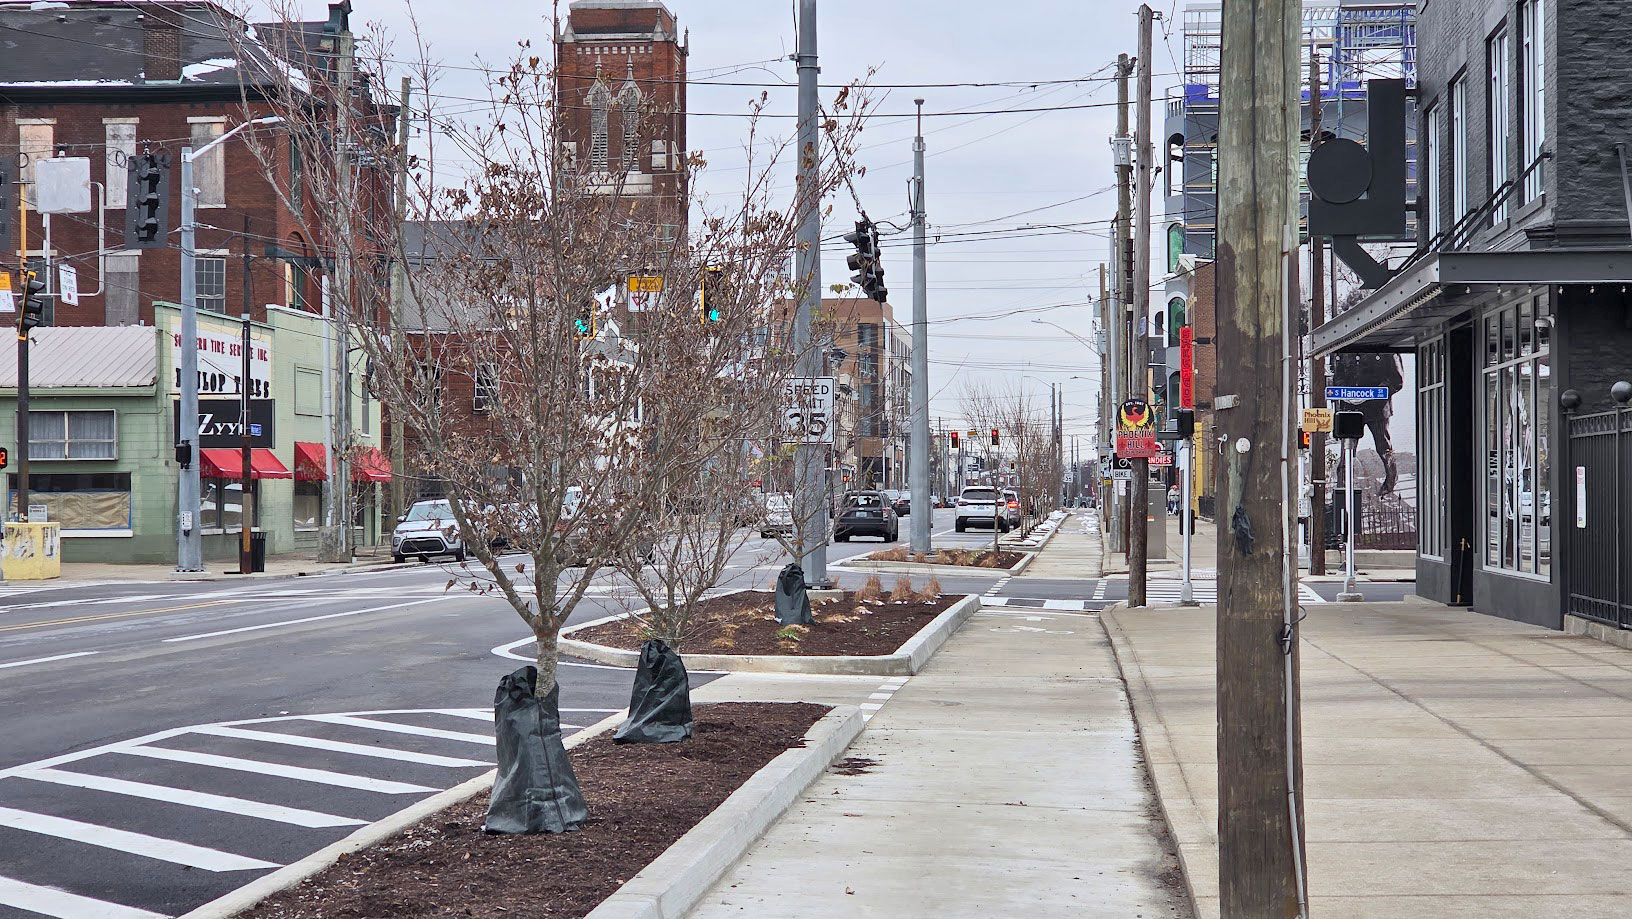
The hot-spots in this post and the intersection analysis have a good amount of overlap, but combined they provide a relatively comprehensive image of the most problematic roads in Louisville. This does not provide a definitive reason for why these roads are dangerous, that cannot really be attained without some individual study on the ground. Despite that, literature does indicate that certain features make crashes more likely such as nearby land-use, lack of presence of complete street features such as bike lanes and street trees, and wide lanes.